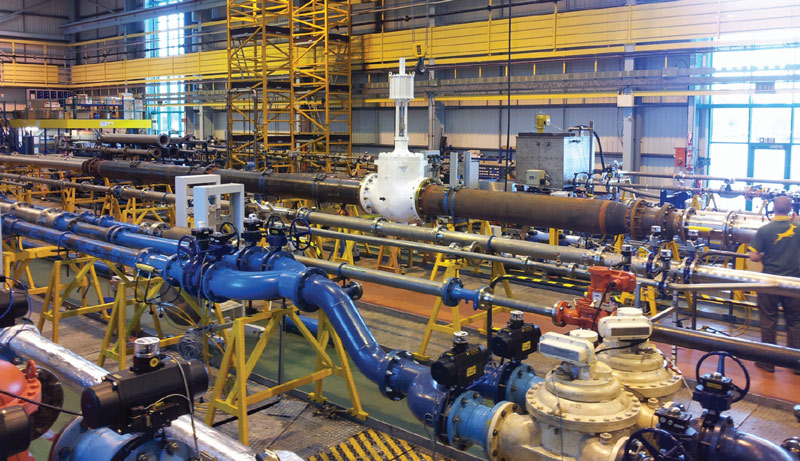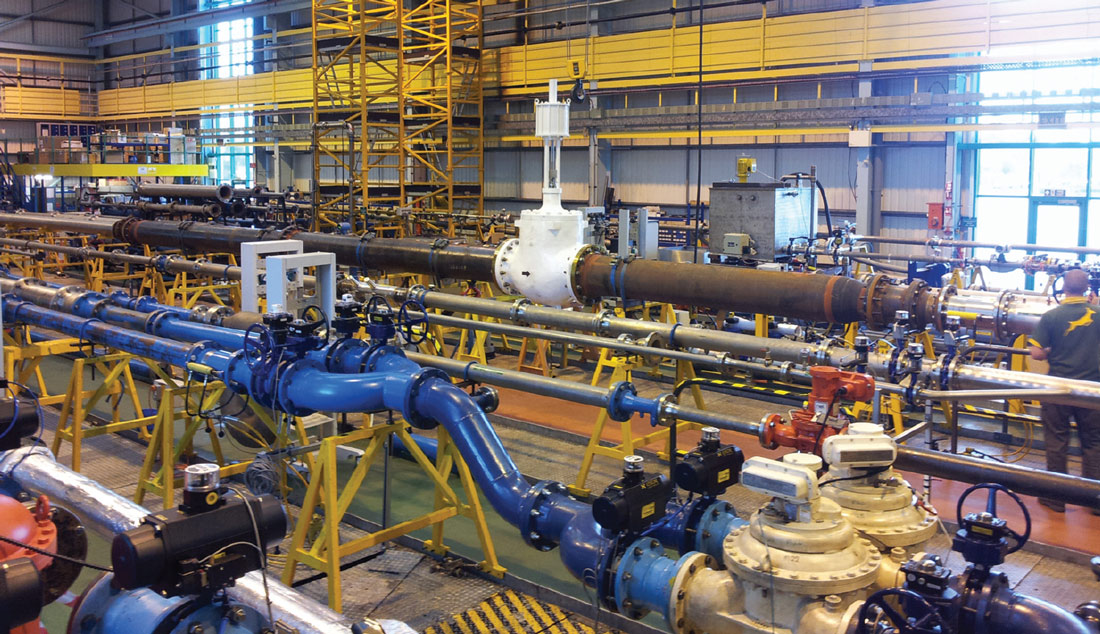
When sizing a control valve for a particular application, it is important to know parameters such as the Flow Coefficient (CV) or Pressure Recovery factor (FL) to determine if the valve will meet its intended duty. This article will go deeper into the process for determining valve capacity via flow testing and will also explore wear mechanisms such as erosion and cavitation that affect control valve performance over time.
By Tariq Boussouara
About the Author
Tariq Boussouara is a project engineer at TÜV SÜD National Engineering Laboratory. He is the technical lead for dry gas calibrations and valve flow testing. He is also the custodian of temperature traceability, and acts as an independent witness for flow calibrations. He is currently a lead developer of NEL’s new data acquisition, uncertainty, and calculation software.
There are several benefits to determining the capacity of a control valve via a flow test. At TÜV SÜD National Engineering Laboratory (see box text), numerous valves have been tested for both manufacturers and end users. These were often new or bespoke valve designs, so it was important to validate their capacity before they were installed.
In some cases, the capacity of the valve determined via testing indicated a significant deviation from predicted data. Without a flow test, this would have gone unnoticed until after installation, and by that point it may be too late to rectify any problems. Valves are often destined for environments where unexpected problems such as reduced valve capacity can prove costly e.g., a subsea installation. Flow testing ultimately provides confidence that valves will meet their required duty.
The main purpose of a flow test is to determine the valve Flow Coefficient (CV) and the Pressure Recovery Factor (FL). Both are important terms when it comes to valve sizing and operation.
Flow Coefficient
Flow Coefficient The Flow Coefficient (Cv) is a ubiquitous term in the valve world. In simple terms, it expresses the efficiency of a valve at allowing flow. Cv is the flow rate of water in US gallons per minute at 60 °F, that will result in a 1 psi pressure drop across the valve. It is an industry standard parameter used for sizing and comparing valves and is important for control valve selection. With Cv, you can calculate the pressure drop across a valve for a given flow rate, or vice versa.
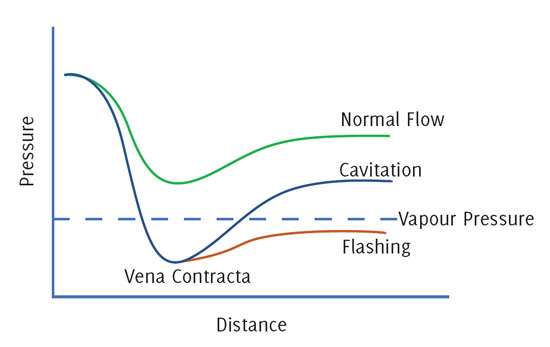
The Liquid Pressure Recovery factor (FL) reflects the capability of the valve to transform kinetic energy of the fluid at the vena contracta (the point where the flow reaches its highest velocity and lowest pressure), into pressure energy.
In practice, it is difficult to measure the pressure at the vena contracta, therefore FL is usually calculated based on choked flow conditions via a flow test. The FL number is important as it can be used to predict choked/cavitating flow conditions for a control valve. High recovery valves will have a low FL number, and vice versa. Valves with a low FL number are generally more susceptible to choked flow and cavitation.
Choked flow and cavitation
Cavitation occurs when the pressure drops below the vapour pressure of the fluid but then recovers above the vapour pressure as it exits the valve. This pressure recovery results in the collapse or implosion of vapour bubbles that have formed, leading to significant noise emission and erosion of the valve trim.
For flashing, the downstream pressure remains at or below the vapour pressure so a mixture of liquid and vapour travel downstream of the valve. This can result in vibration due to the imbalance between the liquid and vapour phases and can lead to erosion from jet droplet impact. Choked flow in liquid occurs when enough vapour has formed within the valve where no further increase in flow rate can be achieved by increasing the differential pressure. This condition is usually avoided as cavitation intensity in the valve will be severe.
To effectively predict when cavitation/choked flow starts to develop in a valve, it is important to have confidence in both the valve Cv and FL number, which can be determined via flow testing.
Control valve flow testing
The main test standard for control valve capacity flow tests is ANSI/ISA-75.02.01-2008 Control Valve Capacity Test Procedures. It details the requirements for testing valves to determine both CV and FL. Some key considerations are:
• The flow rate, differential pressure and temperature of the fluid need to be measured with a low uncertainty; a traceable flow facility and test setup is therefore required.
• Upstream and downstream pipework should closely match the valve bore, with enough upstream length to minimise flow distortion as it enters the valve.
• Pressure taps should be located 2 diameters upstream and 6 diameters downstream of the valve. This accounts for pressure recovery, as measuring the differential pressure too close to the valve body could result in inaccurate pressure measurement.
• To suppress cavitation, the inlet pressure to the valve should remain high. This is achieved by throttling the flow down-stream of the valve.
• The flow must remain turbulent, with a Reynolds number of at least 100,000 recommended.
Determining the Flow Coefficient Cv
To determine the Flow Coefficient, the valve should be tested at a minimum of three differ-ent flow/pressure combinations for each valve travel position. Once the flow rate, differential pressure and specific gravity of the fluid have been measured, the CV can then be calculated for each test point using the formula below:

Where Q is the flowrate, SG is the specific gravity and ΔP is the differential pressure.
If the test setup is correct, the CV calculated at each flow condition should broadly be the same. Any deviation from the average of the three points may indicate the presence of cavitation and should be investigated.
Determining the Liquid Pressure Recovery Factor FL
To determine the FL number, this is one of the rare scenarios where it is desirable to achieve choked flow within the valve. This can be done by decreasing the back pressure on the valve
to a minimum, to induce as much vapour formation as possible. Once this extreme has been reached, a series of data points can then be taken as the differential pressure across the valve is slowly reduced. The FL number can be calculated using the formula below:

Where Qmax is the flow rate at choked conditions, P1 is the inlet pressure, PV is the vapour pressure, SG is the specific gravity, CV is the flow coefficient, and FF is the liquid critical pressure ratio factor.
Comprehensive characterisation
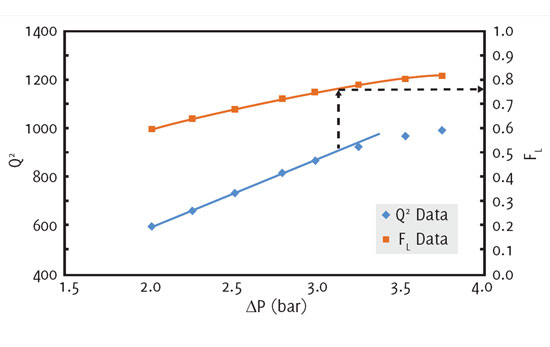
It is then a case of plotting the data and identifying when the flow starts to choke, and the corresponding FL number at this point. If there is little to no cavitation in the valve, the flow rate squared (Q2) versus the differential pressure (ΔP) should be a linear relationship. Any deviation indicates the formation of vapour, the flow is becoming choked, and the cavitation intensity is increasing, (see figure top right, the dotted arrows indicate the point at which this linear relationship starts to break down).
In this way, a conservative FL number can be determined that indicates when cavitation is just starting to make itself evident hydrodynamically, rather than fully choked flow. FL numbers are usually based on fully choked flow, however, it is not recommended to operate at this condition as noise and material erosion can be severe. This is one of the benefits of conducting a flow test, as it allows a comprehensive characterisation of the flow across the full pressure drop domain. Once determined, the FL number can be used to calculate the pressure drop required to achieve choked/cavitating flow for a given inlet pressure.
Control valve wear mechanisms
Validating the capacity of control valves via flow testing comes with numerous benefits. However, it is important to be aware of several wear mechanisms that can damage and ultimately change the capacity of a control valve over time.
Corrosion is one of the main causes of damage to control valves. This is where the metal in the valve reacts with the environment (e.g., oxidation), leading to a change in the composition and ultimately degrading the valve. This can increase the internal surface roughness, which can often result in higher pressure drops. Cavitation as discussed can result in material loss due to collapsing vapour bubbles which damage the valve trim over time, and lead to excessive vibration and noise. Particle erosion is another common wear mechanism, where solid particles in the fluid (e.g., sand) impinge on internal surfaces at high velocity, removing material. This erosion rate has an exponential relationship with the particle velocity.
These wear mechanisms all affect control valve performance, and in severe cases lead to loss of containment of the process fluid and total failure of the valve. Limiting these wear mechanisms as much as possible is therefore beneficial.
Preventing or managing wear
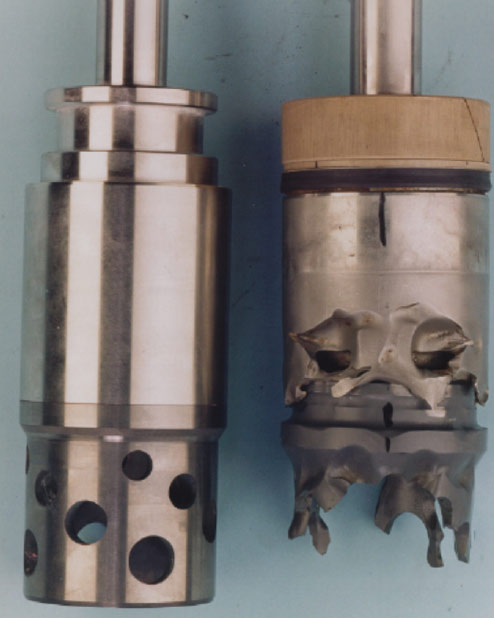
To prevent cavitation, one solution is to use valves that utilise a multi-stage trim. Instead of one large pressure drop, the pressure is dropped in multiple stages due to the unique design of the valve. The fluid pressure is therefore less likely to drop below the vapour pressure, suppressing cavitation. Increasing the inlet pressure to the valve by throttling the flow downstream can also be effective. The impact of particle erosion can be reduced in several ways. The most effective solution is velocity reduction of the fluid, as this will result in an exponential reduction in the erosion rate. The valve body can also be upgraded to an erosion resistant material, such as tungsten carbide. However, some erosion resistant materials can be more brittle than standard materials which should be considered.
CFD
Computational Fluid Dynamics (CFD), along with accelerated erosion testing, can also be an effective tool for managing erosion. Valves can be subjected to accelerated erosion in an experimental facility (such as TÜV SÜD National Engineering Laboratory’s erosive flow facility) to predict their useful life. Erosion is quantified via weight loss and dimensional measurements, and valve CVL can be monitored before and after damage. This data can then be used to tune a CFD model to accurately predict valve erosion. Once validated, the CFD model then provides an effective management tool for predicting the life of control valves in erosive environments, allowing shutdowns and changeouts to be planned effectively.
In summary, flow testing a control valve can provide peace of mind that the valve will successfully meet its required duty. It can also provide a comprehensive characterisation of the flow through the valve over the full pressure drop domain. However, there are also several wear mechanisms that can damage and change the capacity of control valves over time, such as cavitation and particle erosion. In those instances, mitigation measures can be implemented and tools such as CFD and experimental testing can predict the working life of control valves in arduous environments.
About TÜV SÜD National Engineering Laboratory
The company is a global centre of excel-lence for flow measurement and fluid flow systems and is the UK’s Designated Institute for Flow and Density Measurement, with responsibility for providing the UK’s physical flow and density measurement standards. TÜV SÜD National Engineering Laboratory is a trading name of TUV SUD Ltd, a company of the TÜV SÜD Group, an international service organisation. More than 24,000 employees work at over 1,000 locations in about 50 countries to continually improve technology, systems and expertise. They contribute significantly to making technical innovations such as Industry 4.0, autonomous driving and renewable energy safe and reliable. www.tuvsud.com/en-gb/nel


