Q: I am familiar with how to calculate the pressure drop at which choked flow will begin in a control valve. Do you know how to determine at what point cavitation damage will begin?
A: The method that I am familiar with and have used extensively for many years with good results in predicting cavitation damage is based on the fact that the same thing that causes damage also causes the noise, namely the collapse of vapor bubbles.
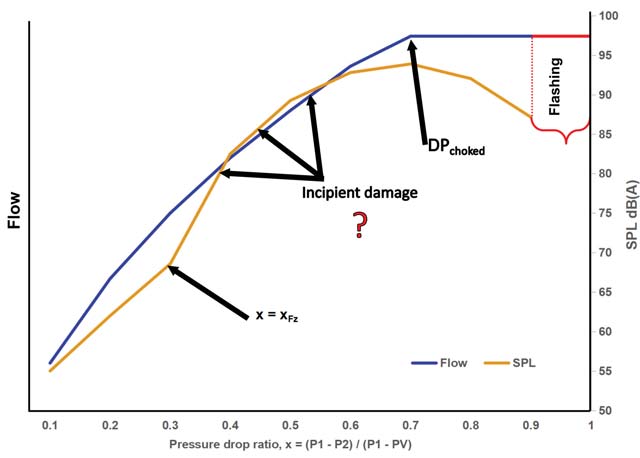
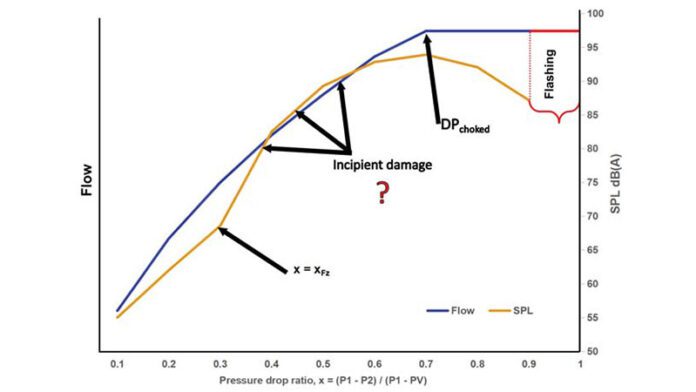
Figure 1 shows a typical relationship between pressure drop, expressed as pressure drop ratio x, which is defined as x = (P1 – P2) / (P1 – PV), where P1 is the pressure upstream of the valve, P2 is the pressure downstream of the valve and PV is the vapor pressure of the liquid.
At low pressure drop ratios, the noise is low and the flow is turbulent with no cavitation bubbles forming or collapsing. The point labelled x = xFz is where cavitation bubbles start to form and above xFz noise starts increasing more rapidly. xFz, the point where the first cavitation noise begins, is a valve parameter based on noise tests and published by several valve manufacturers for each valve style at each ten percent increment of valve travel.
At first, as the pressure drop increases beyond x = xFz, so does noise. Experience has shown that cavitation damage is not a problem at first. At some point the noise reaches a maximum. This point tends to be near where the pressure drop across the valve equals ΔPchoked which corresponds to fully choked flow, and where cavitation damage is almost sure to become unacceptable. The trick is determining the incipient damage point, which involves time-consuming tests. Consequently, there is practically no information on exactly where this incipient damage point is.
The idea of correlating noise with cavitation damage got its start in 1985 when Dr Hans Baumann published an article in Chemical Engineering magazine1 where, based on some limited damage tests, he established a maximum SPL of 85 dBA as the upper limit to avoid unacceptable levels of cavitation damage in butterfly valves. To verify this premise, a valve manufacturer I was associated with for many years did a study of many applications, where in some cases cavitation damage was minimal and in others it was excessive.
The conclusion of the study was that it is possible to predict that damage will be within acceptable limits if the predicted noise level is below limits established in the study. Limits determined in the study are: Up to 3 inch valve size: 80 dBA, 4 to 6 inch: 85 dBA, 8 to 14 inch: 90 dBA and 16 inch and larger: 95 dBA. These limits are compatible with noise calculations made using the method described in IEC 60534-8-4, Noise Considerations – Prediction of Noise Generated by Hydrodynamic Flow, Edition 3.0.
Note that the graph Figure 1 of flow from low-pressure drop ratios up to the choked flow point is not a straight line. That is because, most commonly, flow in a valve vs pressure drop graph is on a square root of pressure drop scale, but here the pressure drop scale is linear. This subject is also presented in more detail in Reference 2, which can be downloaded from my website at no charge.

Reference 1: Chemical Engineering. March 18, 1985, pp 149 – 153.
Reference 2: Flow Control. May, 2018, pp 14 – 17.

About the author
Jon F. Monsen, PhD, PE, is a control valve technology specialist with more than 45 years of experience in the control valve industry. He has lectured nationally and internationally on the subjects of control valve application and sizing. Jon currently hosts a website, www.Control-Valve-Application- Tools.com where he freely shares articles, training and professional development materials, and Excel worksheets that might be of interest to those who use or specify control valves. He can be reached at cvapptools@gmail.com.


