

Excessive noise can be damaging to personnel and equipment. Predicting and limiting unacceptable noise levels in the workplace is essential.
By Steve Boyle & Jon Monsen
To protect workers’ hearing, most industrial plants specify that the maximum noise generated by process equipment (such as control valves) not exceed 85 or 90 dB(A).
Excessive noise can also cause equipment damage and community noise problems. The key factors involved in gas noise are understood, and are explained here. These factors are used to help predict and limit any unacceptable noise.
This article focuses on noise made by compressible fluid flow, not liquids. However, hydrodynamic noise has many similarities in its creation and treatment. Damage from cavitiation is the biggest concern there.
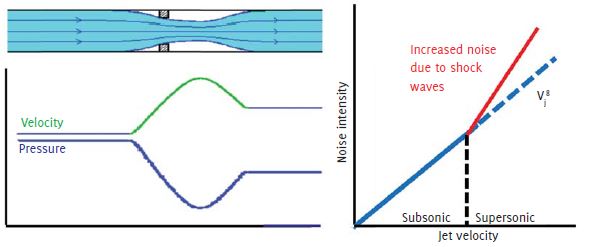
When gas flows past the restriction in a control valve the velocity increases and reaches a maximum at the vena contracta. Because of conservation of energy, when the velocity increases, the pressure must decrease. When the pressure decreases, the gas expands.
Almost immediately after the gas passes through the vena contracta the pressure increases and the gas contracts. This rapid expansion and compression causes severe turbulence and possibly shock waves, which generates noise. The sound intensity is strongly related to the peak velocity, Vj. At subsonic velocities, the sound intensity is related to the jet velocity raised by the eighth power. At supersonic velocities, the relationship between velocity and intensity is even greater due to shock waves; see Figure 1.
Supersonic flow
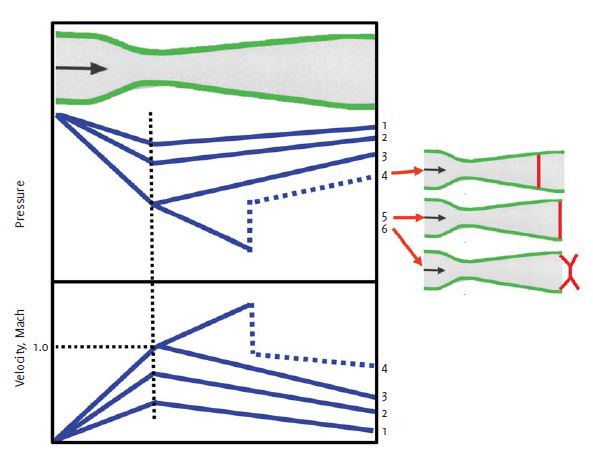
Shock waves caused by supersonic flow are a source of very high noise levels. The top section of Figure 2 represents a venturi that has been installed in a pipe. The middle section is a graph of pressure at different points in the venturi and at various flow rates.
The lower section is a graph of velocity within the venturi. The Y axis of the velocity graph has units of Mach number, where a Mach number of 1 means that the flow is at sonic velocity. Mach 1 is the highest velocity that is physically possible at the point of greatest restriction.
(It is, however, possible for the velocity to be greater than Mach 1 downstream of the restriction.) If the pressure downstream of the venturi was just slightly below the upstream pressure (say at Point “1”) there would be a small flow of gas through the venturi. At the throat of the venturi, the velocity would reach a small peak, and the pressure would have a small dip, reaching a minimum at the throat of the venturi. If the downstream pressure were lowered to Point “2”, the flow rate would increase, and the velocity at the throat would have a higher peak and the pressure a larger dip.
Lowering the downstream pressure to Point “3” would increase the flow to the point where the velocity at the throat just becomes sonic (Mach 1). Now, if the downstream pressure is lowered further to Point “4,” the flow at the restriction does not increase anymore because the velocity at the throat is already Mach 1, and it is physically impossible for it to be any greater. However, the velocity downstream of the throat becomes supersonic.
As the velocity increases, the pressure also continues to decrease. Somewhere downstream of the throat, the velocity suddenly drops to below Mach 1, and at the same time, the pressure suddenly increases. This sudden change in velocity and pressure takes place over a space the width of only a few gas molecules and is called a shock wave, or sometimes a stationary shock.
Because of the sudden change in pressure and density in a very small space, severe turbulence and high noise levels are generated. Further lowering of the downstream pressure causes the shock wave to move downstream. Shock waves tend to attach to physical boundaries and take on complex and interacting shapes, creating even greater turbulence and noise. The turbulence generates sound waves which propagate down the pipe, with some of the sound coming through the pipe wall where we hear it.
Reducing noise
There are two strategies for reducing noise: source control, and path control.
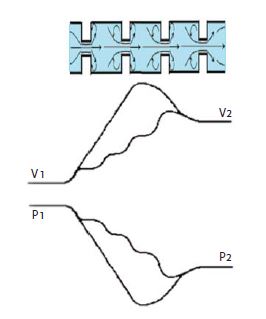
Source control is doing something to the valve to make it less noisy, and path control is doing something to prevent the noise from reaching the people who would be bothered by it. There are two concepts that are used for source control of aerodynamic noise. The first method of source control of aerodynamic noise is called ‘pressure drop staging.’ Pressure drop staging means that instead of taking the entire pressure drop in one step, the pressure drop is divided up into several steps. See Figure 3.
When the pressure drop is taken in more than one step, the individual velocity peaks are smaller than the velocity peak that would result from a single stage pressure drop. Since noise is commonly proportional to velocity to the eighth power, small reductions in velocity can have a large effect on reducing the noise. The second method of source control of aerodynamic noise is called ‘flow division.’ See Figure 4.
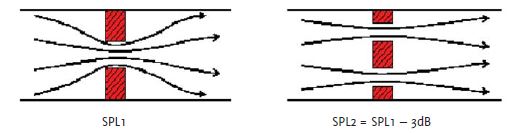
Flow division means that instead of having the flow pass through a single opening, the flow is divided up so that it passes through several openings in parallel. In general, every time you double the number of openings, you reduce the noise by 3 dB(A). The reduction is due mainly to the fact that the smaller openings shift the noise to a higher frequency.
The higher frequencies are attenuated more as the sound passes through the pipe wall than are the lower frequencies. Also, because the human ear (and the ‘A’ weighting curve on sound meters) attenuate higher frequencies, both the measured and perceived noise is decreased. These noise reduction concepts have been incorporated into many practical low noise valve designs. Two examples are given below.
Figure 5 illustrates an extremely effective design, combining both pressure drop staging and flow division. The design is similar to a cage guided globe valve, except the cage is made of a stack of disks. Each disk has a pattern of multiple, multi turn channels etched or otherwise formed into it. The multiple channels provide flow division, and the multiple turns in the channels provide pressure drop staging. It is possible to have several changes of direction, each taking a small portion of the overall pressure drop. Notice here that the flow is from outside to inside (flow-to-close). Also notice that the area increases along the flow path to allow the gas to expand, as required for effective noise abatement.
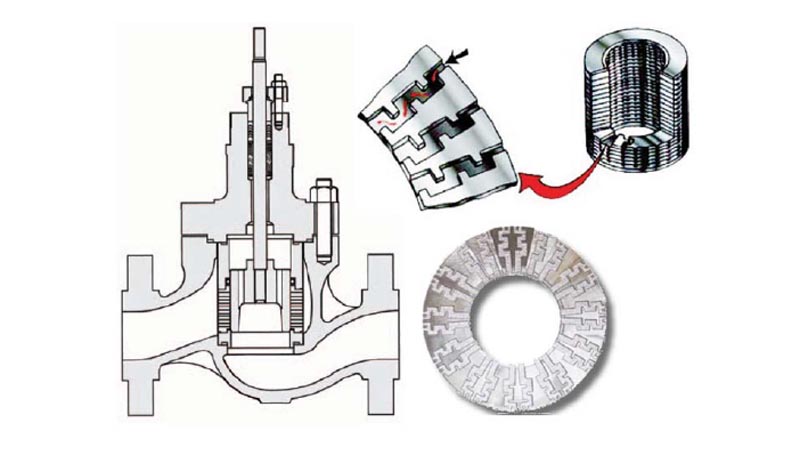
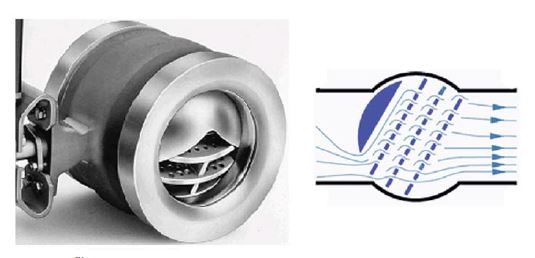
Figure 6 is a segment ball valve that incorporates both pressure drop staging and flow division to achieve aerodynamic noise reduction. There are three metal plates inside the ball segment with multiple holes drilled in them. Depending on opening, the overall valve pressure drop is taken in up to four stages. And in the last three pressure drop stages the pressure drop is taken through the multiple holes which also provide flow division.
Path control of noise simply means doing something to the path between the internal point of noise creation and the external environment.
Heavy wall pipe downstream of the valve can lower the noise heard outside the pipe. Using schedule 80 pipe can lower the noise by 4 to 6 dB(A) and using schedule 160 can lower the noise by 10 to 13 dB(A). A downside is that heavy wall pipe is expensive.
Pipe insulation can also lower the noise. Thermal insulation (which may be required in some applications for energy conservation) can reduce the radiated noise by 5 dB(A) per inch. The pra ctical limit of thermal insulation due to acoustic ‘short circuits’ is a thickness of about 2.4 inches. Acoustic insulation can reduce the noise by 10 dB(A) per inch. Both heavy wall pipe and insulation must be continued for as far downstream of the valve as noise reduction is needed (in most cases, noise tends to be more important in the downstream direction). Also, note that these treatments do not reduce the noise intensity at the interior source so that vibration and damage can still occur.
In summary, noise caused by gas flowing through control valves can be predicted and controlled using the concepts outlined here. For a highly detailed discussion of this topic, see the reference box.
About the author
 Steve Boyle, MS Engineering, is a control valve technology and acoustic noise specialist, with more than 45 years of experience working in the valve and other industries. Currently retired, he participates in technical standards development, including serving as Chair of ISA Working Group 75.07 on Control Valve Noise. He can be reached at sjbdc@aol.com.
 Jon F. Monsen, PhD, PE, is a control specialist with more than 45 years of experience in the control valve industry. He has lectured nationally and internationally on the subjects of control valve application and sizing. Jon currently hosts a website, www.Control-Valve-Application-Tools.com where he freely shares articles, training and professional development materials, and Excel worksheets that might be of interest to those who use or specify control valves. He can be reached at cvapptools@gmail.com.
Reference
Valmet Flow Control Manual pp 71 -90 https://www.valmet.com/globalassets/sharepoint/imported/flowcontrol_manual.pdf
About this Technical Story
This Technical Story is an article from our Valve World Magazine, November 2023 issue. To read other featured stories and many more articles, subscribe to our print magazine. Available in both print and digital formats. DIGITAL MAGAZINE SUBSCRIPTIONS ARE NOW FREE.
“Every week we share a new Technical Story with our Valve World community. Join us and let’s share your Featured Story on Valve World online and in print.”