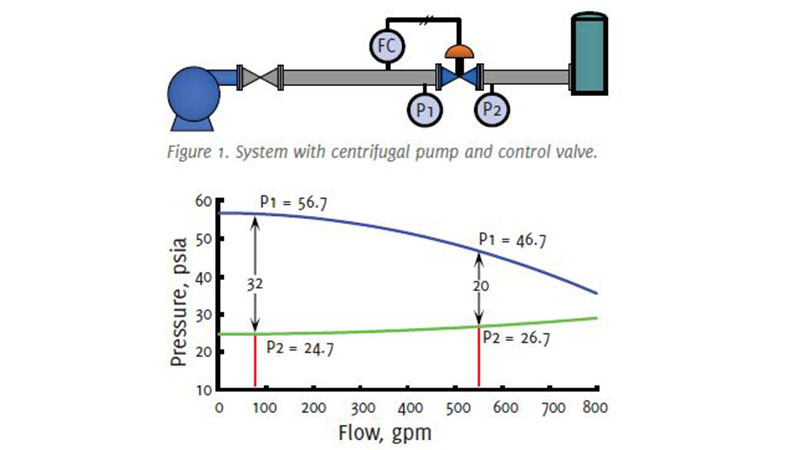
Q: Can you explain how we know that a control valve with an inherent equal percentage characteristic becomes linear when installed in a system with a lot of piping and other pressure-consuming elements?
A: I couldn’t find a simple formula or explanation that verifies this fact, but a computerized analysis, using a mathematical model of a system does confirm that it is indeed the case. To demonstrate this, we will consider the system shown in Figure 1. This is a system with a centrifugal pump and a significant amount of pipe, both upstream and downstream of the control valve. A static analysis shows that as flow changes, the valve inlet and outlet pressures (P1 and P2) change (Figure 2).
I have constructed a control valve sizing Excel® worksheet that can graph the installed flow characteristic of a given valve in the system into which it will be installed. The installed flow graph (Figure 3) is based on the valve manufacturer’s tabulated values of Cv vs relative travel, the user’s input of process flow conditions, and a process model based on the principle that the pressure losses in a piping system are approximately equal to flow squared. The process model used by the worksheet is the one defined in my Control Valve Q&A published in Valve World in May.

Figure 3 is actually two screenshots superimposed on each other from the same Excel worksheet. I have slightly modified the worksheet to graph the actual flow (left axis) in gallons per minute, rather than relative flow. The actual flow reveals the difference in fully-open flow if:

a. he valve pressure drop remains constant with valve travel and flow (blue), or
b. f valve pressure drop decreases with valve travel and flow due to pressure losses in the system (red).
The installed flow characteristic (blue) when valve pressure drop remains constant at all valve openings and flows has the same shape as the valve’s inherent flow characteristic, which is an equal percentage characteristic. When an equal percentage valve is installed in a system where, due to pressure losses in system piping (and other pressure-consuming components such as elbows, isolations valves, heat exchangers, etc.), not only is the shape of the relationship between valve travel and flow changed, but the fully open valve flow capacity is significantly reduced.
The red flow curve shows that when the valve travel is relatively small, the pressure drop does not change much, so the installed flow graph’s shape is not much different than the inherent flow curve of the valve. However, as the relative valve position increases, due to the flow-squared nature of pressure loss in the piping system, the pressure drop available to the valve starts decreasing rapidly, causing the flow to increase more slowly, ending up much less when the valve is fully open. The result of this analysis is that a valve with an equal percentage inherent flow characteristic will exhibit a nearly linear installed flow characteristic when installed in a system with a significant amount of pipe and/or other pressure-consuming elements.

About the author
Jon F. Monsen, PhD, PE, is a control valve technology specialist with more than 45 years of experience in the control valve industry. He has lectured nationally and internationally on the subjects of control valve application and sizing. Jon currently hosts a website, www.Control-Valve-Application- Tools.com where he freely shares articles, training and professional development materials, and Excel worksheets that might be of interest to those who use or specify control valves. He can be reached at cvapptools@gmail.com.


