A cycling control loop can be a major contributor to unwanted process variability. In this technical paper, control valve expert Jon Monsen examines the phenomenon of stiction, resolution and dead band.
By Jon Monsen, Consultant
A cycling control loop can be a major contributor to unwanted process variability and can often be traced to one or more of the following:
- Composition of incoming raw materials,
- Composition of incoming additives,
- Process equipment,
- Process control design,
- Inadequate mixing/agitation,
- Ineffective tuning of control loops
- Poor performing control valves.
For this discussion, we will only address the last point. About half the time, a cycling loop can be traced to the control valve.
Stiction
One important area of valve performance is “stiction.” Unlike friction, which is the rubbing of one object or surface against another, stiction is the static friction that needs to be overcome to enable relative motion of stationary objects in contact. The result of excessive stiction in a closed loop control system is a limit cycle and process variability.

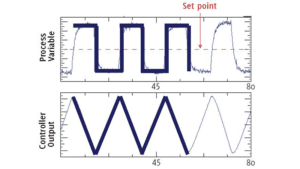
Refer to Figure 1. Look at the process variable trace and the horizontal line that has been drawn over the PV trace at the upper left side of the graph. The valve is stuck, and the process variable is above set point. The integral (or reset) action of the PID controller ramps the controller output in an attempt to correct the error until enough pressure builds up in the actuator to break the static friction. Because dynamic friction is lower than static friction, the valve moves quickly to a new position.
Before the static friction broke, enough pressure had built up in the actuator that the new process variable value is now below set point. As a result, the PID controller reset action now starts ramping the controller output in the opposite direction in an attempt to correct the new error. The result is a “Limit Cycle.” The characteristic of a limit cycle is that the process variable oscillates in a “square” wave fashion, and the controller output oscillates in a “Saw Tooth” wave fashion.
Dead band
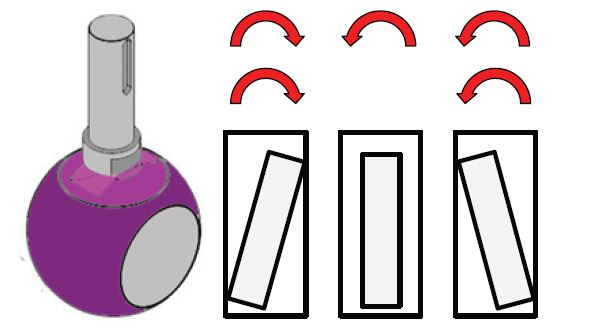
In addition to stiction, dead band can be the result of backlash, a technical term for “slop.” Backlash can result when there is looseness in the connection between two parts. The example here is the connection between the stem and the ball in a ball valve. Many ball valve designs require that the ball be able to float downstream into the seat when the valve is closed to create a tight seal between the seat and ball.

A common design that allows the stem to turn the ball, but also permits the ball to float slightly when the valve is closed, is pictured in Figure 2. The ball has a slot into which a “blade” on the end of the stem fits. To allow manufacturing tolerances and to assure that the ball can freely float into the seat, there will be a small gap between the blade and the slot in the ball. In Figure 2, this gap has been greatly exaggerated. In the left-hand drawing of the slot and blade, the stem is turning clockwise and driving the ball in the clockwise direction. If the stem stops turning, then continues in the clockwise direction, the ball will immediately follow the stem without delay.
If the stem stops, then reverses direction, turning in the counterclockwise direction, it will take a finite amount of time for the blade to take up the space between the stem and ball before the ball starts turning in the counterclockwise direction. The result is backlash which contributes to dead band.
Stiction, resolution & dead band
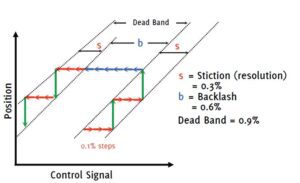
Figure 3 describes the details and definitions relating to stiction, resolution and dead band. Stiction and backlash are two important factors that determine how well a control valve can control the process. Position is graphed as a function of the control signal, and time is left out. Stiction is the result of the interaction between static friction (which is high) and dynamic friction, which is much lower. Backlash is lost motion due to looseness or “slop.” Imagine a loose actuator-to-valve stem coupling. Once the “slop” is taken up, as long as motion continues in the same direction, the valve will follow the actuator. When the actuator reverses direction, the valve does not move until the actuator has moved enough to take up the play. The test for stiction and backlash sends a series of small steps of control signal to the valve, first in one direction, then in the reverse direction.

Look at the three right-hand facing arrows on the lower right side of the graph. In the example, it takes three 0.1% steps of control signal before there is enough actuator force to break the static friction and move the valve. Under the lower dynamic friction, the valve then moves 0.3% and catches up to the control signal. If we send some more 0.1% control signal steps in the same direction, it takes another three of them before the static friction breaks, and the valve again moves 0.3% and catches up to the control signal. In the example, the stiction is 0.3%, that is the control signal must change by 0.3% before the valve will move. This represents the resolution or precision with which it is possible to position this valve.
If there is some “slop”, play or lost motion in the valve’s linkages or actuator linear-to-rotary conversion, it will take a number of small control signal steps in the opposite direction just to take up this play before the actuator can even begin exerting force to try and break the static friction. You can see that it takes 6 of the 0.1% steps, so in this example, the backlash is 0.6%. Now, it will take several additional control signal steps for the actuator to exert enough force or torque to break the static friction (stiction) and start the valve moving in the reverse direction, and a similar process is repeated.
The dead band, which is defined as the amount the control signal must be changed upon reversing signal direction before motion begins, equals the backlash plus the stiction. Here the dead band is 0.9%NOTE that the dead band does not degrade the resolution. This valve can be positioned within 0.3% of where you want it positioned even upon reversal of the control signal. The dead band does require a certain amount of time for the reset action of the controller to drive the valve through it, and this will show up as process dead time. Dead time is one of the worst things you can add to a process from the viewpoint of making the process difficult to control.
Effect of dead band
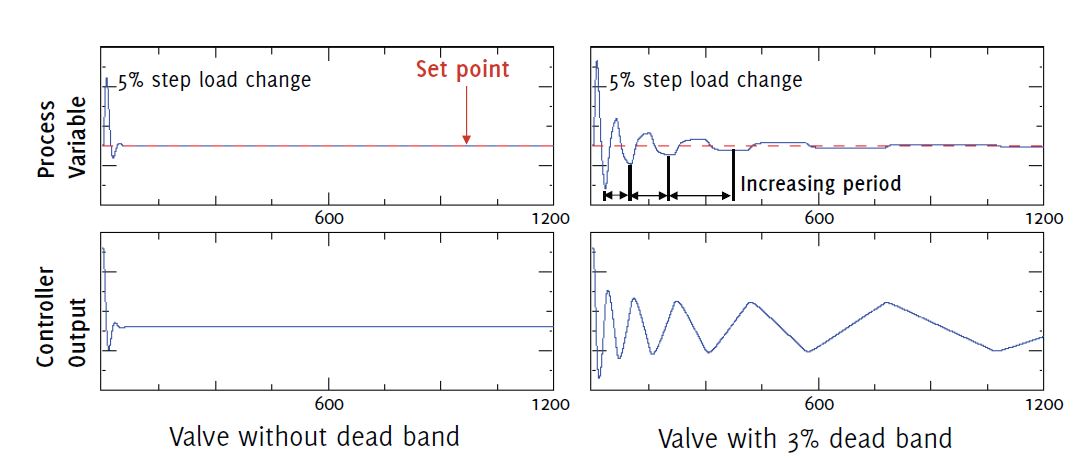
Figure 4 demonstrates the effect of dead band on process control. Both pairs of graphs represent the response to a 5% step change in load. The pair of graphs on the left is a process where the valve has zero dead band, and the pair of graphs on the right represent a process where the valve has a dead band of 3%. In both cases, the controller is tuned for fast but robust response to load changes.
The increased instability is caused by the fact that when the controller sees the upset to the process that requires the valve to move in the opposite direction from its last movement, the reset action starts driving the valve right away but takes some time for the dead band to be overcome and for the valve to start moving. During this time, no correction is being applied to the process upset. Each time a correction is made, the error is less. The smaller the error, the slower the controller reset action is, and the longer it takes for the controller to overcome the valve’s dead band. This appears as an increasing time delay or dead time. The full scale on the Process Variable graph is 4% of span and the time scale is in seconds.

About the author
Jon F. Monsen, PhD, PE, is a control specialist with more than 45 years of experience in the control valve industry. He has lectured nationally and internationally on the subjects of control valve application and sizing. Jon currently hosts a website, www.Control-Valve-Application-Tools.com where he freely shares articles, training and professional development materials, and Excel worksheets that might be of interest to those who use or specify control valves. He can be reached at cvapptools@gmail.com.


