EN 13555 includes tests for tightness, creep relaxation, Qsmax and E-Modulus of gasket materials excluding tests at cryogenic conditions. Cryogenic temperatures significantly influence the characteristics of the sealing materials. It is known that at -40 °C binders in elastomer bonded sheet gasket materials are getting brittle.
By Florian Werner, TEADIT International Produktions GmbH
Subject of investigations
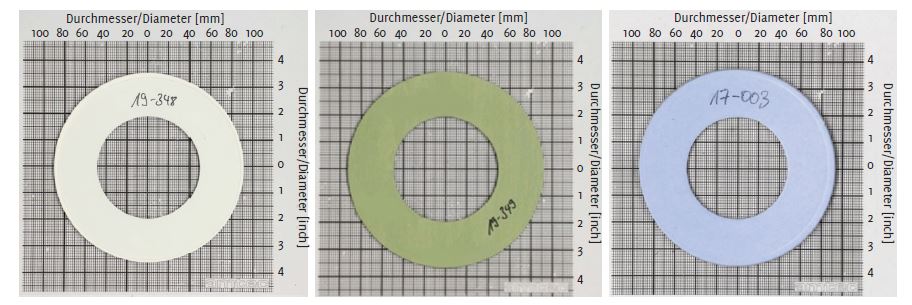
Three different gasket materials, cut out of sheets, were tested for this:
- Structured PTFE with hollow glass microspheres (TF 1570)
- 100 % expanded PTFE (ePTFE 24 SH)
- Compressed non asbestos fiber gasket (CNAF)
The aim of the investigation is to determine the following gasket parameters based on the test procedures of EN 13555:
- Maximum permissible gasket stress Qsmax (-50, – 100, -150 °C),
- Modulus of elasticity EG (-50, -100, -150 °C),
- Creep relaxation factor PQR (-50, -100, – 150 °C),
- Minimum gasket stress at assembly Qmin(L) (40 bar/ -150 °C) and
- Minimum gasket stress at operating condition Qsmin(L) (40 bar/ -150 °C).

Testing
The tested gaskets have the standard dimension DN40/PN40. The gasket thickness is 3 mm for structured PTFE (TF) and 2 mm for expanded PTFE (ePTFE) and fiber gasket (NA). The tests were carried out on the equipment shown in Figure 2 in the laboratory of AMTEC Messtechnischer Service GmbH.
Compression test
In this compression test, the gasket is cooled down to the test temperature at a low gasket stress before the test gasket is then subjected to increasingly higher loads in loading and unloading cycles until the gasket fails. The result in this test is used to determine the maximum permissible gasket stress at operating conditions Qsmax(T) for the gasket.
The modulus of elasticity EG of the gasket material can be determined from the compression curve at alternating between loading and unloading the gasket with defined stresses.
Creep relaxation test
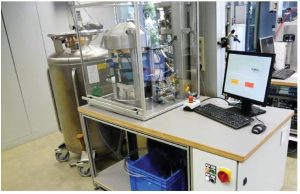
In the creep relaxation test, the gasket is pressed to the initial gasket stress before the test gasket is cooled to the test temperature. The temperature is then kept constant for 4 hours and the relaxation behavior of the seal is determined. For this purpose, after setting the initial gasket stress, the stiffness of a flange connection is simulated by regulating the gasket stress in a displacement-controlled manner.
The ratio of the residual gasket stress at the end of the test to the initial gasket stress results in the creep relaxation factor PQR, which is given as a function of the initial gasket stress, the test temperature and the system stiffness.
Leakage test
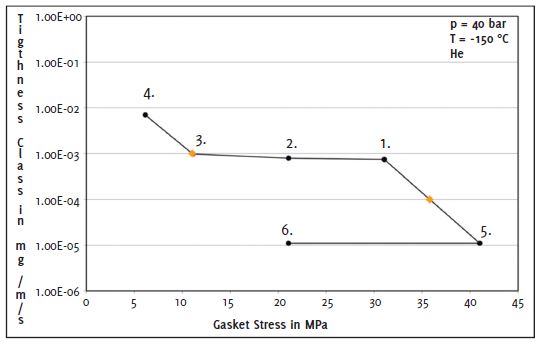
In the leakage test, the gasket is loaded to a predefined assembly gasket stress of 30 MPa before the test item is cooled to a test temperature of -150 °C. The gasket is then unloaded and loaded again in several steps, with the leakage rate determination for each load step. In addition to the loads of 30 and 40 MPa, unloading curves are also drawn up. The smallest load level is 5 MPa. The test medium for these leakage tests is helium and test pressure is 40 bar.
The required minimum gasket stresses Qmin(L) and Qsmin(L) can be determined from the leakage curve for the various tightness classes L, depending on the previously applied initial gasket stress QA.
Results and discussion
- Maximum permissible gasket stress Qsmax (-50, -100, -150 °C) at operating temperature,
- Modulus of elasticity EG (-50, – 100, -150 °C), which describes the deformation behaviour of the gasket,
- Creep relaxation factor PQR, which describes the decrease in gasket stress due to creep of the gasket under load and temperature,
- Required minimum gasket stress Qmin(L) for tightness class L,
- Required minimum gasket stress Qsmin(L) for tightness class L depending on the initial gasket stress QA.
Compression test
The tests were carried out at -50, -100 and -150 °C. Based on the test standard, intermediate reliefs were also recorded to determine the elasticity of the gasket. The gasket parameters Qsmax and EG determined from these curves are tabulated.
The compression test at -50 °C shows a continuous increase in the elastic modulus. The TF gasket shows stronger deformations at the gasket stress levels above 60 MPa. At -100 °C, a similar behavior only occurs in the last step above 80 MPa. The gasket shows no signs of damage. The modulus of elasticity increases steadily as a function of the gasket stress.
In the compression curves at -150 °C, no gasket damage can be identified up to a load of 100 MPa. The course of the modulus of elasticity at -150 °C increases continuously with increasing gasket stress up to 100 MPa in all tests. The lower the temperature, the bigger the curve slope which shows a stiffer material with higher E-Modulus.
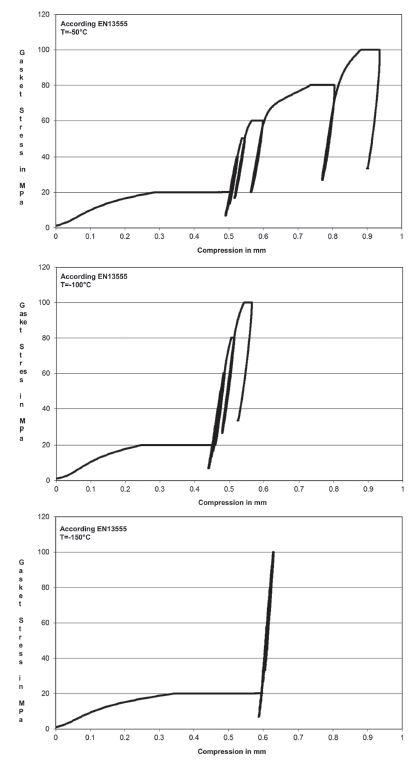
The maximum tested gasket stress was set at 100 MPa at all temperatures. No damage to the test specimens was found in the tests carried out. Figure 3 shows the different compression curves for -50, -100 and -150 °C. The lower the temperature, the less the seal deforms as the load increases.
Figure 4 compares the EG values at 30 MPa and the different temperatures. As the temperature decreases, the modulus of elasticity increases at the same time. The modulus of elasticity at RT is 1063 MPa and at -150 °C the modulus of elasticity is already 4621 MPa.

Figure 5 compares the E-modulus of TF with ePTFE and NA. ePTFE is slightly higher than the TF, which is also caused by the thinner initial thickness of the ePTFE gasket. The fiber gasket, which is also 2 mm thick, has a significant higher E-Modulus.

Creep relaxation test
Creep relaxation tests were carried out at different temperatures and with a stiffness of 500 kN/mm. The initial gasket stress was set at 30 MPa. The creep relaxation factor PQR for TF was tested in a range from 0.64 to 0.77, for NA at 0.91 to 0.93 and for ePTFE at 0.89.
Figure 6 shows that cooling down from ambient to -150 °C the PQR result decreases. Temperature expansion has a significant impact. Figure 7 illustrates the shrinkage of PTFE as it cools down to -150 °C.


Figure 8 compares the PQR of TF with ePTFE and NA. The different gasket thicknesses of TF, ePTFE and NA must be taken into account. The lower the PTFE gasket thickness, the higher the PQR value.
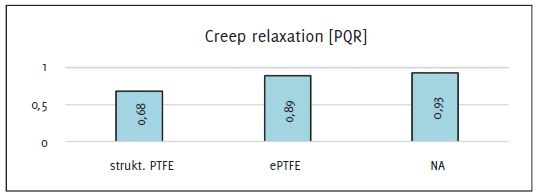
ePTFE shows a higher PQR versus TF. The fiber gasket has the highest PQR value. The fiber gasket is so hard at -150 °C that no further deformation of the gasket occurs. In terms of safety, elastomer or elastomer-based gaskets should be checked in additional tests at cryogenic conditions.
Leakage test
In these tests, the tightness class L0.001 was already achieved at a surface pressure of 30 MPa. If the seal is further stressed to 40 MPa, the leakage rate continues to drop. The unloading steps were carried out up to a gasket stress of 5 MPa and show only a slight increase in the leakage rate.
The following leakage result, fits to the typical leakage performance of this gasket material, as shown in Figure 9. Unfortunately, there are no further results for the other sealing materials available so that comparisons can’t be made.
Summary and conclusion
The results clearly show that tests based on EN 13555 are possible up to -150 °C. The first EN 1591-1 calculations have already been carried out with good results using the available gasket parameters for TF.
E-Modulus and Qsmax
The tests to determine the maximum gasket stress have so far only been carried out on TF up to 100 MPa. No damage was found on the gaskets. The maximum gasket stress on the TF material is therefore >100 MPa.
The lower the temperature, the higher the modulus of elasticity. As it is well known, plastics become stiffer, harder and more brittle at lower temperature.
Fiber gaskets in particular requires further investigations for safety reasons due to their significantly higher E-modulus. We classify the measured modulus of elasticity as alarmingly high.
Creep relaxation “PQR”
The PQR value of the TF gasket decrease with lower temperature. If you compare the creep relaxation of ePTFE and NA gaskets with characteristic published values, you can also see smaller PQR values at cryogenic temperature. With ePTFE and NA, this effect is smaller than with TF.
Leakage performance
As expected, the tightness class of L0.001 was reached below 30 MPa. Comparable values are obtained with the results at RT.
About the author
 Florian Werner, MSc, graduated at the University of applied science in Austria in his studies about Material and Process Sciences. Now, he is the Head of Application Engineering for TEADIT International in Austria, overseeing its team of Applications Engineers. Together with his team, he is responsible for gasket selection, flange calculation, installation training, product presentations and many more actions related to customer service. Additionally, he participates as a voting member of a myriad of industrial committees related to bolted flanged joints like CEN, DIN, ASI and ESA.
About this Technical Story
This Technical Story is an article from our Valve World Magazine, February 2024 issue. To read other featured stories and many more articles, subscribe to our print magazine. Available in both print and digital formats. DIGITAL MAGAZINE SUBSCRIPTIONS ARE NOW FREE.
“Every week we share a new Technical Story with our Valve World community. Join us and let’s share your Featured Story on Valve World online and in print.”

