Article by Dr Hans D. Baumann, Ph.D., P.E.
____
Having found the underlying algorithms based on fundamental laws of fluid mechanics and acoustics which enable the calculation of sound levels of compressible fluids emanating from control valves, and thereby simplifying the IEC Standard and improving accuracy, I thought that a similar method applying to gases might also be good. However this task proved to be quite difficult. After much time and effort I finely was able to compress over 40 equations of an IEC prediction standard into three graphs plus a few modifiers. I thought such a simplified graphical method might be a handy alternative to a computerized method. While this method,as exhibited, is valid for air, it could be modified for other gases as long as the specific gravity and sonic velocity are accounted for (see adjustments below).
The results are three graphs
A,
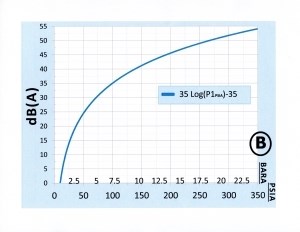
B, and
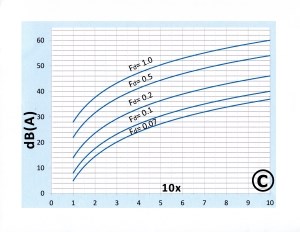
C, which condense the equations of the underlying mathematics.
1) The first graph A shows sound levels as function of the given valve’s outlet pipe diameter(D) either in inches or in mm, and as function of the relative flow capacity (Cv / D2);D in inches, or Cv /(0.04 x d)2 if d is given in mm. The graph also incorporates the pipe’s transmission loss based on schedule 40 pipe (for schedule 80 see below). Note: Cv is based on actual process conditions.
2) The next step is to consult Graph B based on the absolute inlet pressure to the valve either in psia or in bar absolute. Find the appropriate dB(A) numbers corresponding to the valve inlet pressure and add it to the results from Graph A. Then proceed to Graph C.
3) In Graph C, the first step is to find the valve’s pressure ratio, where X = (P1 – P2 / P1), here P1 is the absolute inlet pressure and P2 the absolute outlet pressure. Multiply X by ten and find the corresponding 10X number on the bottom of the graph. Read up to the curve agreeing with the Fd numbers of your valve. Fd affects the diameter of the noise producing jet. Next read the corresponding dB(A) number on the left. (Use the “Tabulation of Fd – Factors” below for estimating purposes in case you don’t know your valve’s Fd number).
The last step is adding all dB(A) numbers from A, B, and C, plus the modifiers listed below, to give the estimated sound level one meter from the pipe wall. This method is based on the mathematical equations shown in the reference1 below and is considered accurate to within +/– 5 dB(A).
| Tabulation of Fd – Factors |
| CV/D2 (D in inches) |
3 |
6 |
9 |
12 |
15 |
18 |
21 |
24 |
27 |
30 |
| (Cv/d2) x 103 (mm) |
4.64 |
9.3 |
14 |
18.6 |
23.3 |
28 |
32.6 |
37.2 |
42 |
54 |
| Globe valve, parb. plug* |
0.27 |
0.31 |
0.39 |
0.46 |
|
|
|
|
|
|
| Butterfly valve |
0.45 |
0.30 |
0.33 |
0.40 |
0.45 |
0.48 |
0.50 |
0.53 |
0.55 |
0.57 |
| Segment. ball valve |
0.60 |
0.62 |
0.65 |
0.68 |
0.72 |
0.73 |
0.75 |
0.77 |
0.78 |
0.80 |
| *Flow to open |
Modifiers
If applicable, here are some modifiers which need to be added to the total:
- If your pipe is schedule 80, add 4 db(A).
- If this is a rotary valve, add rw = 3 dB to the total.
Here is an example from test data shown in the referenced paper (1):
A size 2” (50 mm) globe valve in a 2” (50 mm) pipe, P1 = 72.5 psia (5 bara), P2 = 14.5 psia (1 bar), Cv = 12.5, FL = 1, X = 10x(P1–P2/P1) = 8) and Fd = 0.07, Cv/D2 = 12.5 / 4 = 3.1. Gas : helium (Ng = –4.2 dB). see the section “Adjustment for gases” below.
From the graphs:
- A = 7.3 dB(A) for 2” (50 mm) size and a Cv/D2 of 3.1 or, 12.5/(0.04 x 50)2 = 3.1 also for d in mm.
- B = 30.1 dB(A) for P1 of 72.5 psia (5 bara)
- C = 34 dB(A) based on 10X = 8 = 10x (P1–P2/P1) and Fd = 0.07
Subtract –4.2 for helium
Total estimated sound level per the graphs = 7.3 + 30.1 + 34 – 4.2 = 67.2 dB(A). Test results from Figure 5 of reference 1 = 69 dB at 1 m distance from the pipe and at a pressure ratio P1/P2 of 5. Offset: 1.8dB, see Figure 1. Figure 2 shows the test results for an 8” (200 mm) segmented ball valve installed in a 16” (400 mm) pipe; (D = 16”). Here are the data: P1 = variable (this is a blow-down test), P2 = 14.5 psia (1 bara). In example, P1 = 2.5 bara, Cv = 134, Fl = 0.6 and Fd = 1, rw = 3. Note, here A = 134 / 16”2 or 0.52. As the graph shows, there is reasonable agreement between test data and estimate except in very high pressure ratios. As an example, at P1 =2.5 bara, A = 14, B = 16.1, C = 51, rw = 3. Total: 14 + 16.1 + 51 + 3 = 84.1 dB(A) at 1 meter from pipe (test data at 10X = 10x(P1–P2/P1) of 6 = 89 dB(A)).
Note: This method is not applicable when a valve is installed in an enlarged outlet pipe when the valve’s outlet velocity into the expander exceeds 0.3 Mach. Valves without expanders are exempted from this rule (see Figure 1).
Adjustments for gases
Adjustments for gases other than air can be calculated as follows:
Ng = 10 log(Mgas/28.9) + 20 log(Cigas/343) + 5 log (Gggas/1)
Legend: Mgas = molecular weight (kg/kgmol), Ciggas = sonic speed of gas (m/s), Cggas = specific gravity of gas.
Examples: Ng for sat.steam: 1, natural gas: –4.5, oxygen: +0.3, helium: –4.2, Methane: –1(all in dB(A)).
A question readers may have is the following: “Can I verify my vendor’s prediction in a plant environment?”
Yes, it can be done. However, one has to realize that the actual operating conditions can be quite different from data given to your vendor. The biggest problem is variations in inlet pressure since line losses are based on estimates and there typically are no pressure gauges ahead of the valve. Another consideration is ambient noiselevel from adjacent machinery. For example, a 77 dB ambient noise level can add 1.2 dB to the given valve sound level of 80 dB. Besides calibration problems with sound level meters, here are expected deviations in sound level for each 10% variation in:
- Inlet pressure 2.8 dB
- Density of gas 0.4 dB
- Pressure drop 1.4 dB
- FL factor 1 dB
- Fd factor0.8 dB
- Flow coefficient (Cv/Kv) 0.4 dB.
As can be seen, the inlet pressure is the biggest culprit since it affects pressure drop, jet velocity and mass flow. The combination of some of these could make the verification of a +/– 3 dB prediction problematic.
References
- Baumann, Hans D. A simple aerodynamic noise estimating method: Why not? VALVE WORLD, November 2016, pp 111-116.
- IEC Standard 60534-8-3 Control valve aerodynamic noise prediction method. International Electrotechnical Commission, Geneva, Switzerland.
Acknowledgements
The author extends his gratitude to Mr. John Roper for producing the fine graphs.
Appendix: algorithms for own use
Dr. Baumann has kindly provided the algorithms for the convenience of readers who wish to use this method on their own computers.
A = 25 Log(D) – 10 + 20log(Cv/D2)
B = 35 log(P1) – 35 (Note, if P1 is in bara
use: 35 log(14.5 P1) – 35)
C = 60 – 32 log (10 /10X) + 20log (Fd)
LAe = A + B + C + G + rw in dB(A)
G = 1 for air; for other gases see above,
rw = 0.25 for globe valves, 0.5 for line-ofsight valves.
Example: D = 4 (100 mm) Cv/D2 3.15,
A = 7.4; P1 = 72.5 psia (5 bara), B = 30.1;
10X = 8 with Fd = 0.07, C = 33.7 dB(A)
About the author
Dr. Baumann, a former Vice President of Masoneilan and Fisher Controls created his own company, after serving as international consultant. He was named one of fifty most influential inventors and is credited with over 100 US patents. He has authored 170 publications and seven books, including the Control Valve Primer which is now in the fourth edition. His honours include being elected an Honorary Member of ISA and a Fellow Member of ASME.


